This comparison indicates a change from 1411 lbs/acre (2009) to 2080 lbs/acre (2011) after tiling.

This comparison indicates a change from 97 bu/acre (2010) to 153 bu/acre (2012) after tiling.
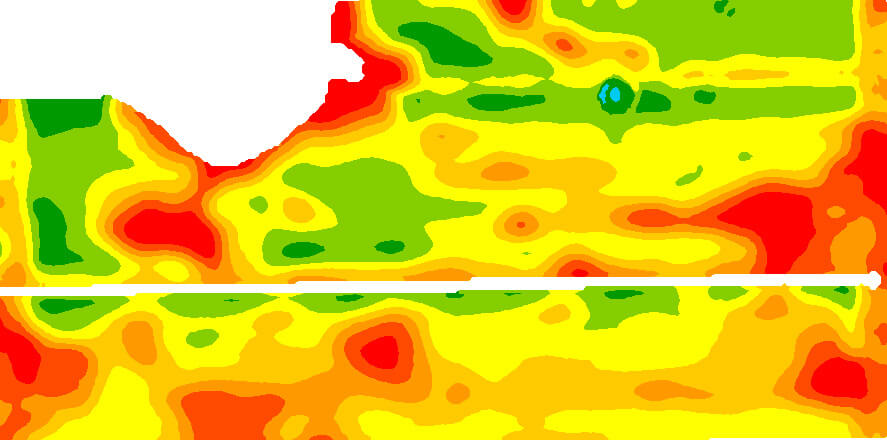


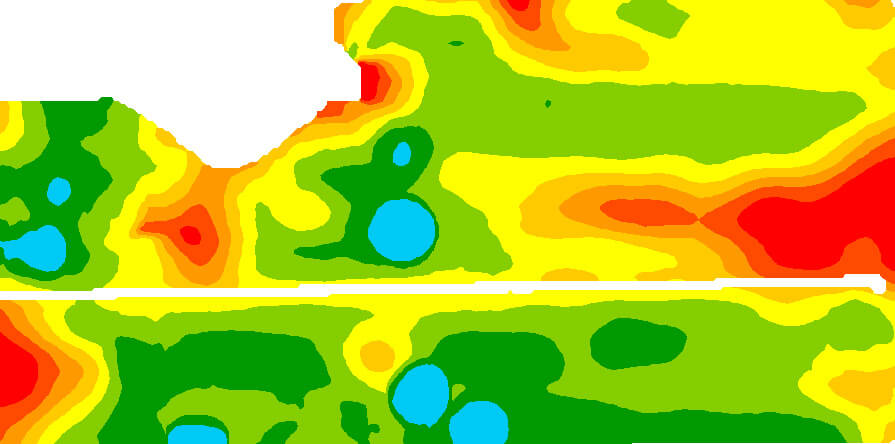
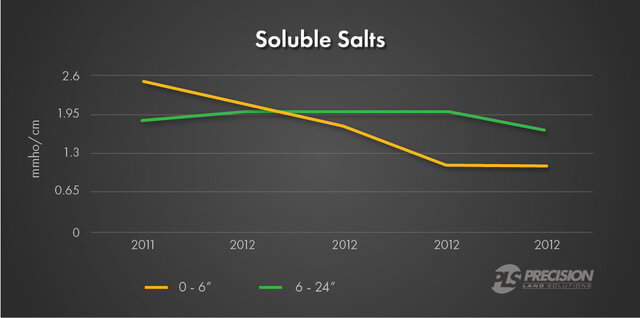
This graph indicates the changes in soluble salts one year after tile drainage being installed. Salinity levels have lowered, especially in the top 6″ of soil; These levels will continue to drop over time.
SUBSURFACE DRAINAGE: TILE DRAINS- Finding solutions to agricultural climate change.
TILE DRAINAGE: RESEARCH RESULTS & ECONOMICS- Watershed resource and managing flooding.
RED LAKE WATERSHED STUDY- Benefits of tile drainage for farmers.
MEASURING THE QUALITY OF TILE DRAINAGE WATER- Nutrient planning for water management.
SALINITY OF TILE DRAINAGE EFFLUENT- The effects of tiling and climate actions.
AGRICULTURAL DRAINAGE FACT SHEET- Land drainage impacts, benefits, and background.
ENVIRONMENTAL BENEFITS OF TILE DRAINAGE- Agronomical and economical reasons for tiling.